GUI in animated GIF
On this page you will find several example of what can be done with the GUI as short animated GIF.
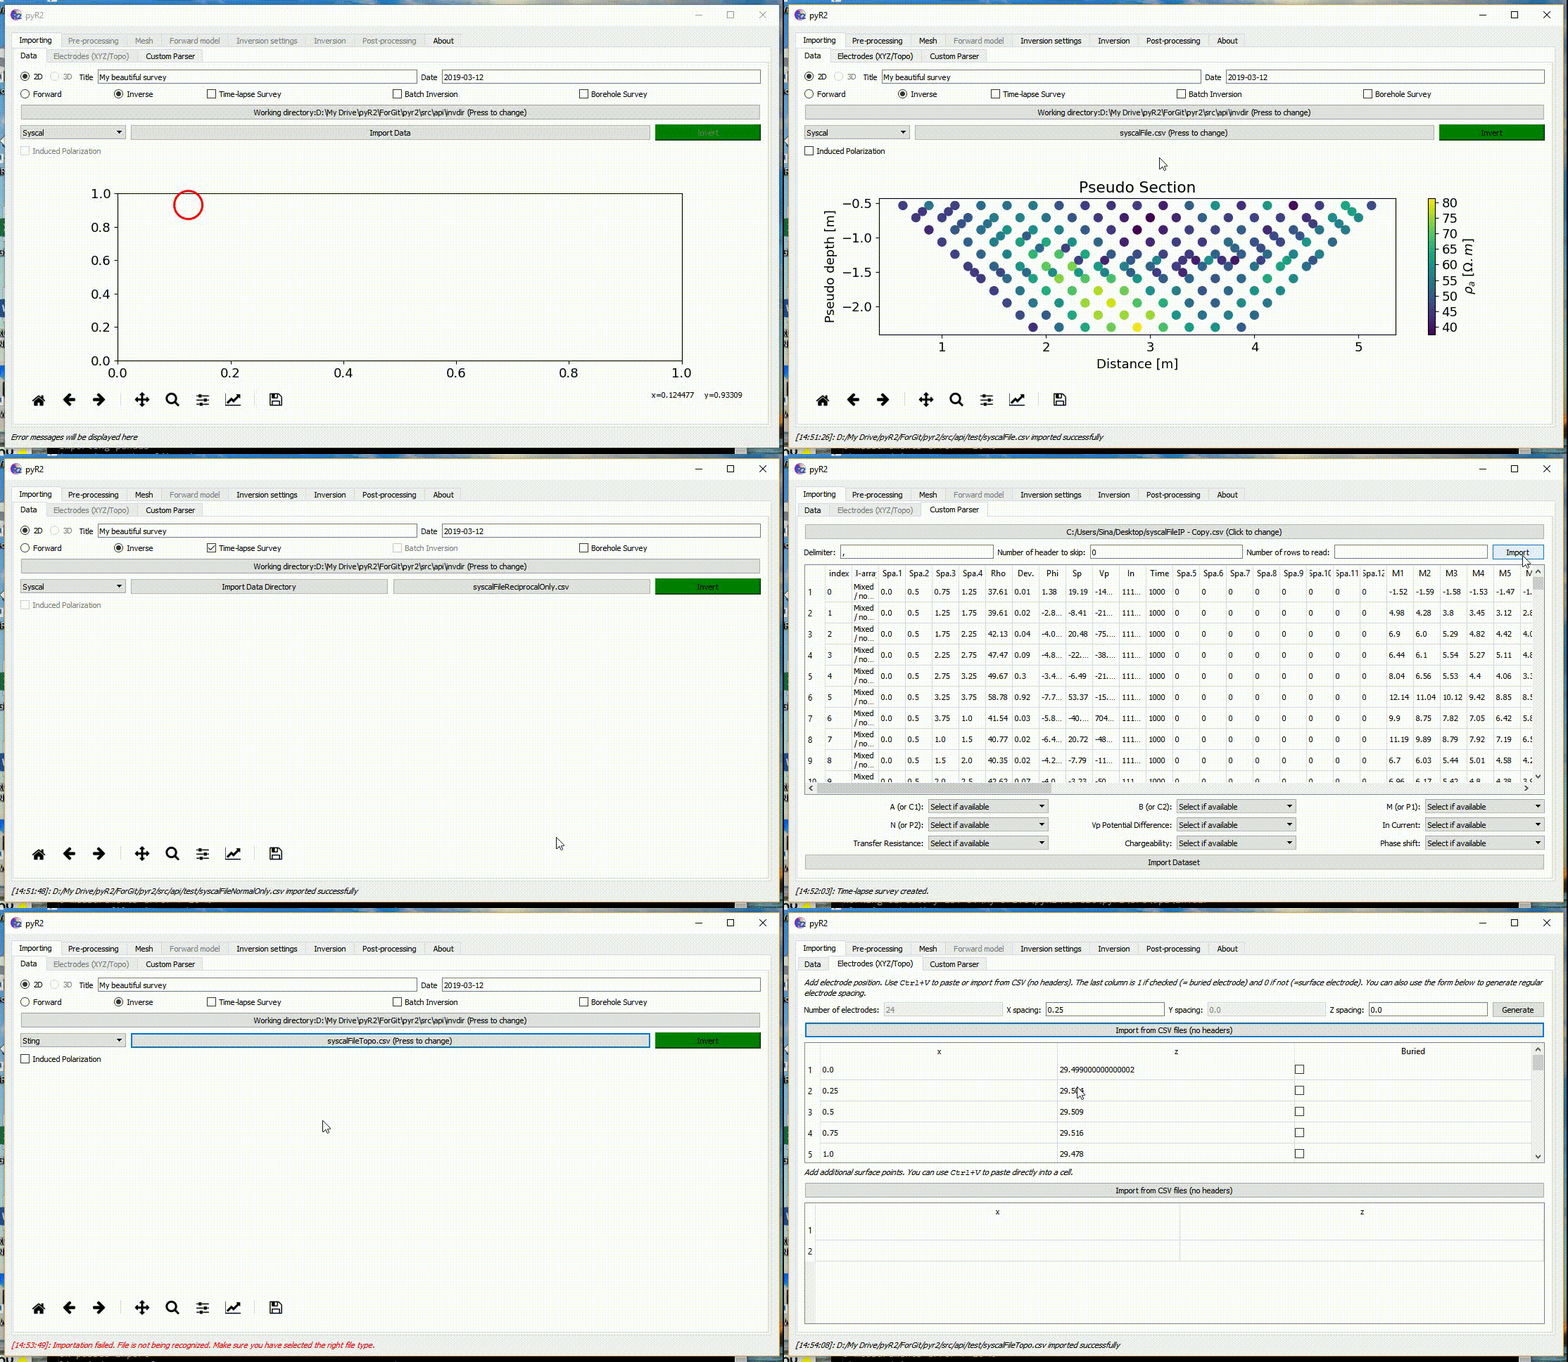
Fig. 6 Importing data. Different parsers are available. DC and IP data can be imported. A custom parser allows to parse in any file type.
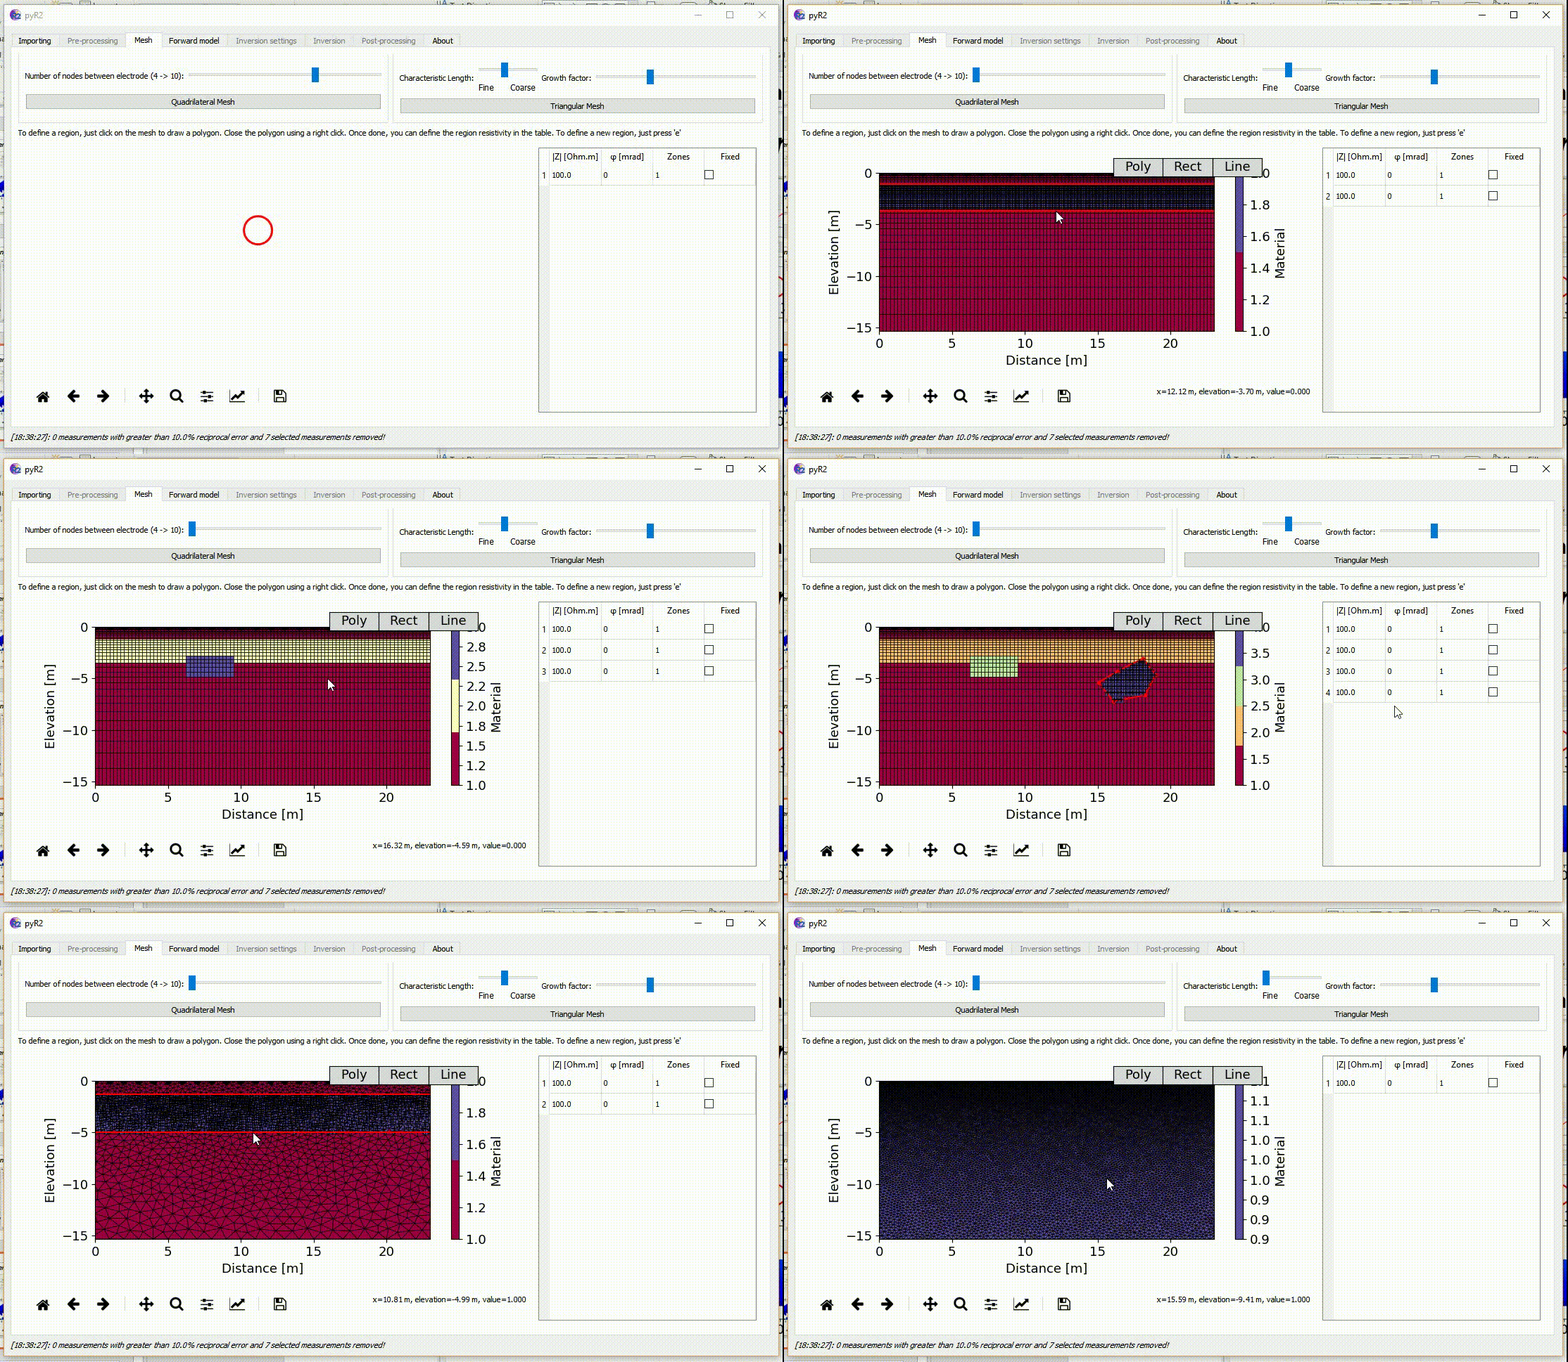
Fig. 7 Creating a mesh (quadrilateral or triangular). Assigning regions of different shapes. Those regions can be fixed, be part of different zones (a zone is a region with a sharp boundary), have a specific starting resistivity and phase value.
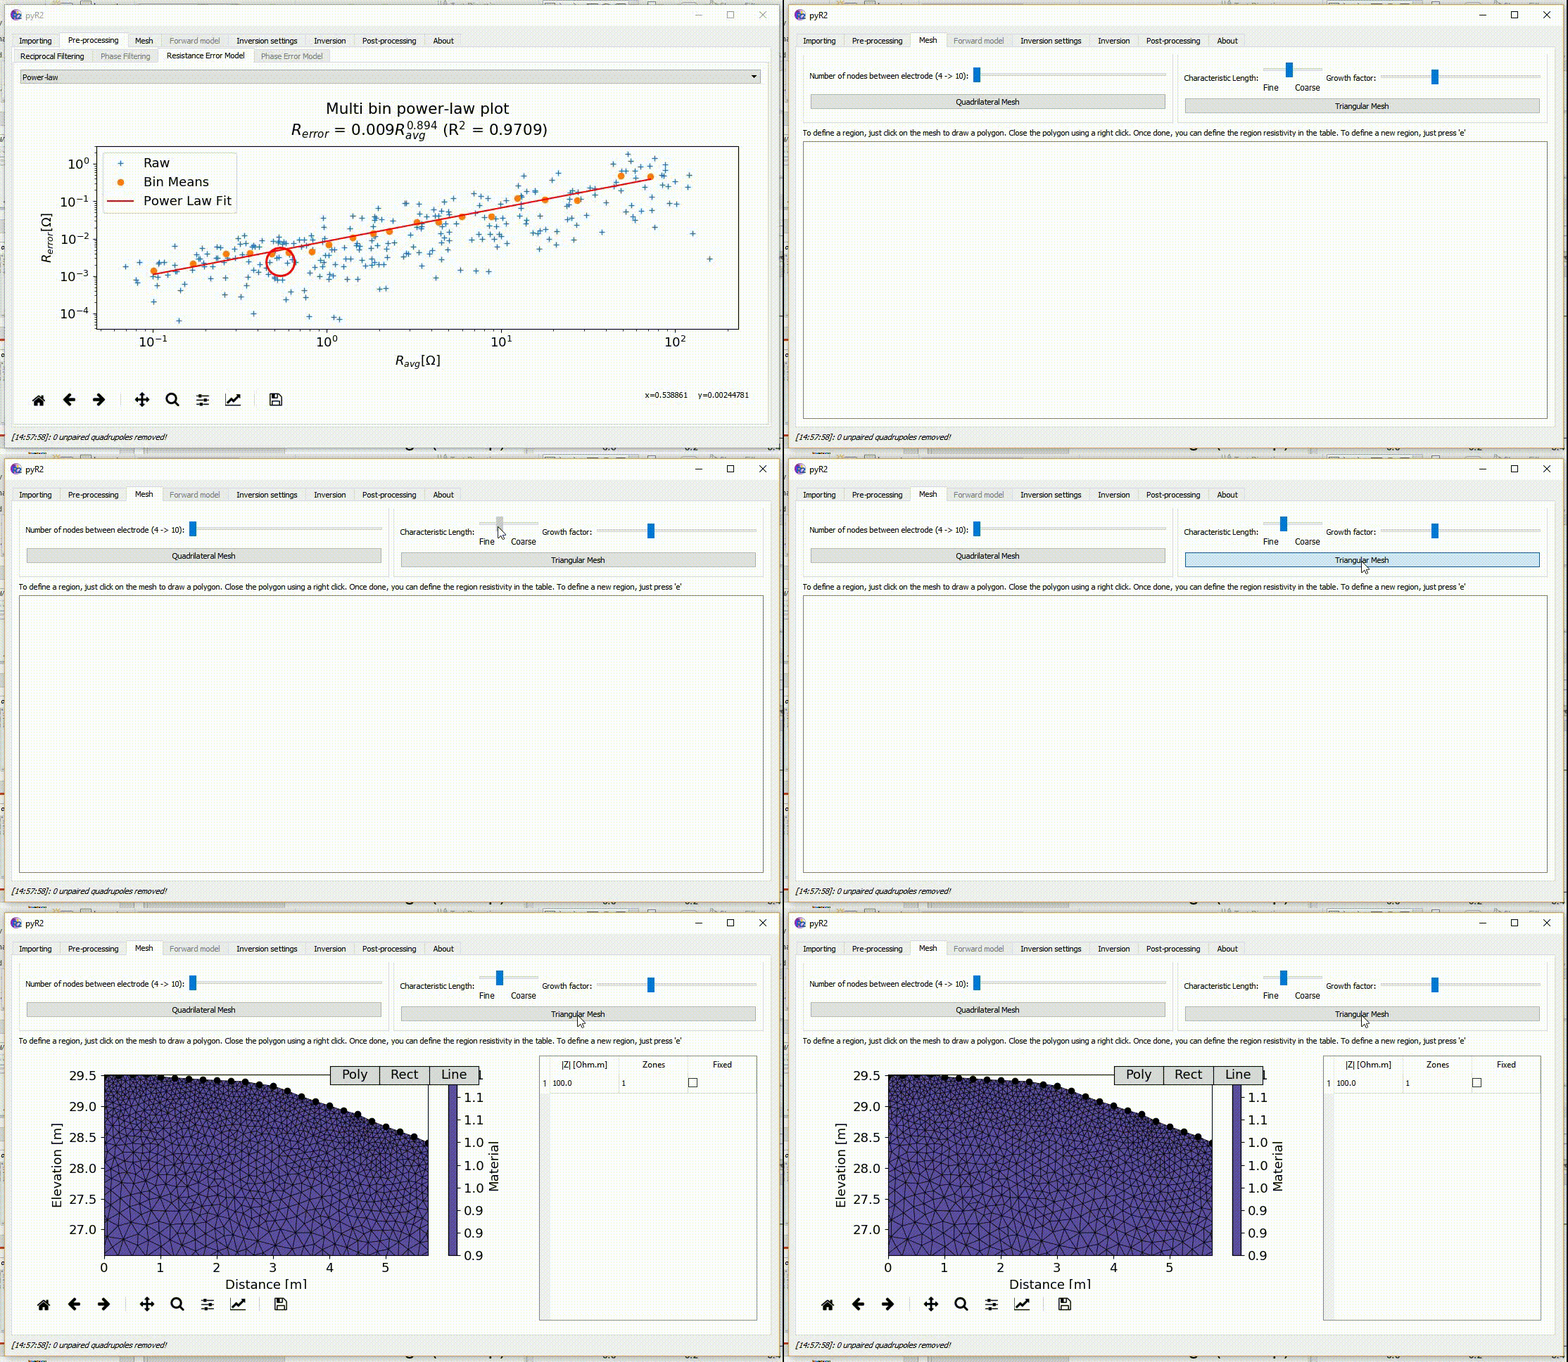
Fig. 8 When topography is supplied the quadrilateral and triangular mesh takes it into account automatically.
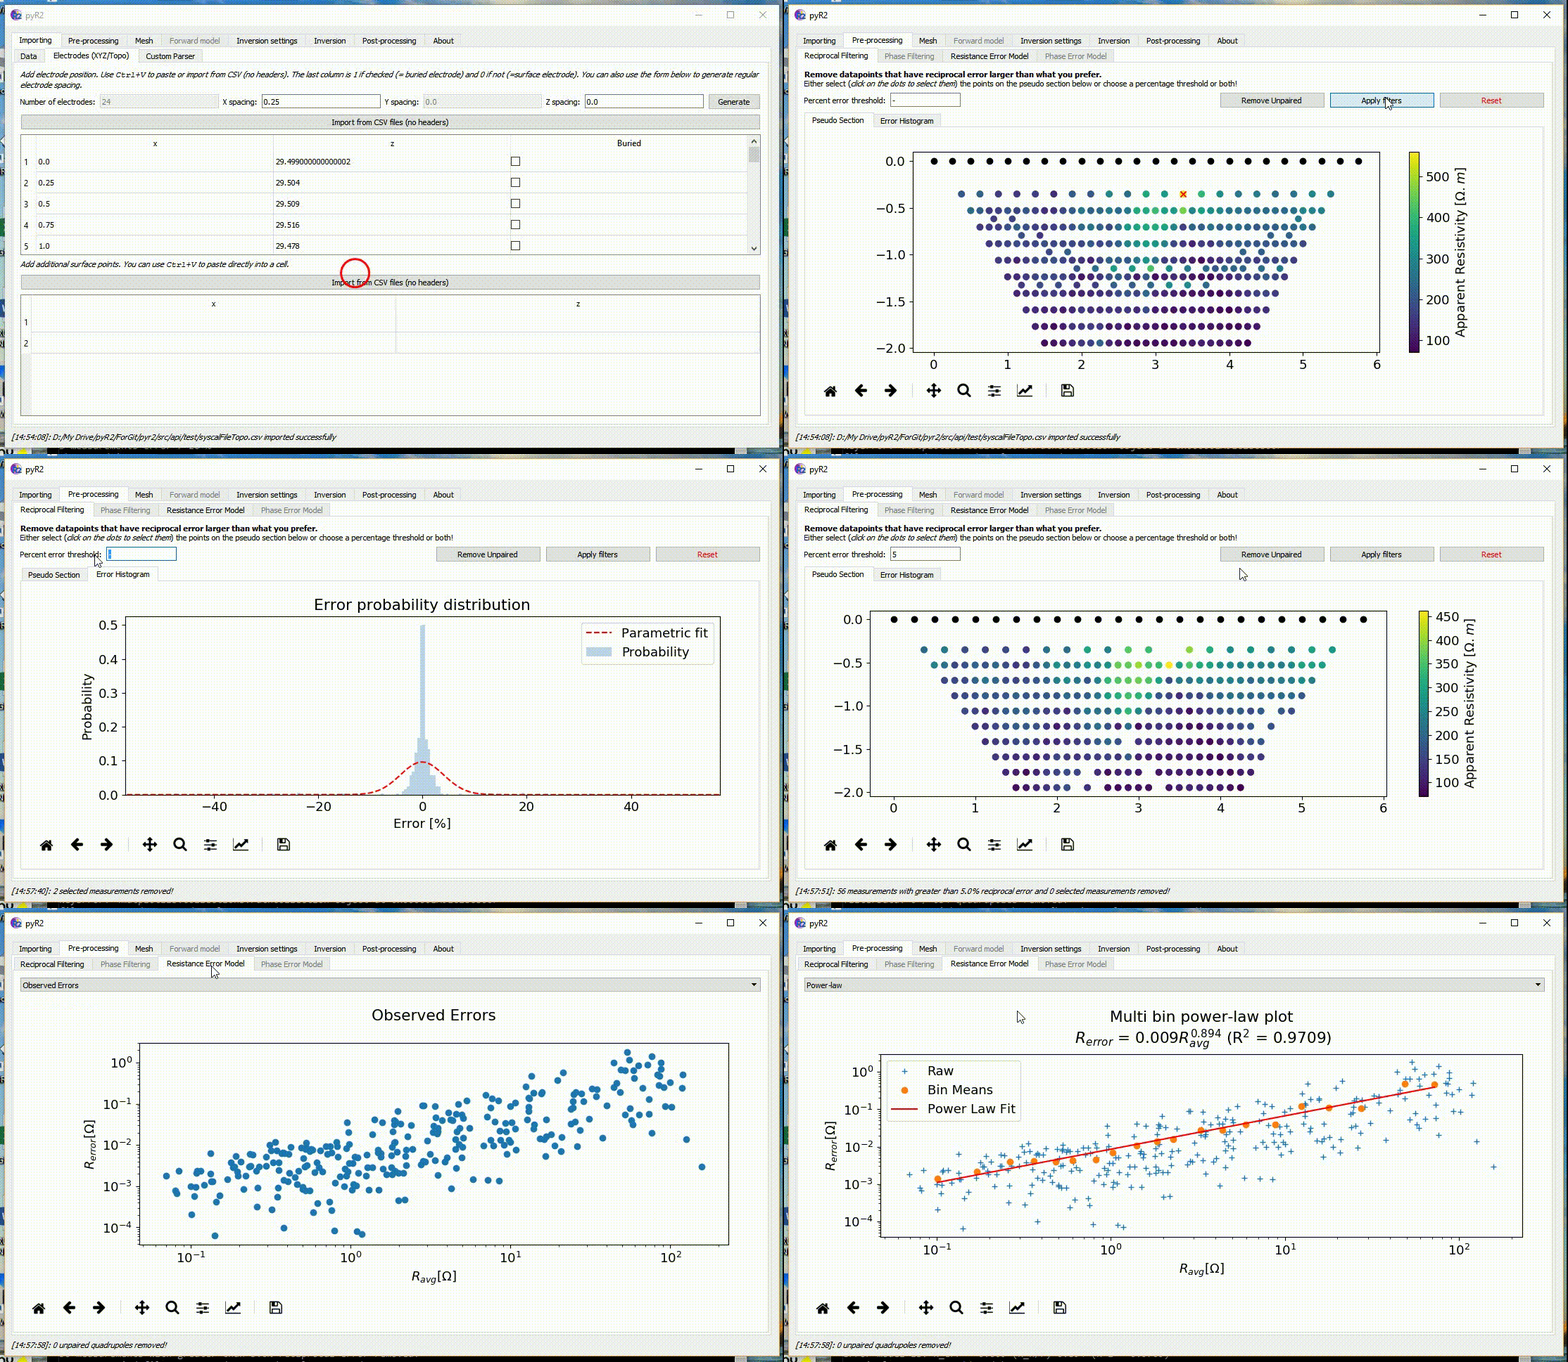
Fig. 9 Data pre-processing for DC data. Data can be filtered manually by selecting bad quadrupoles or/and specific electrodes. A resistance error model can then be fitted.
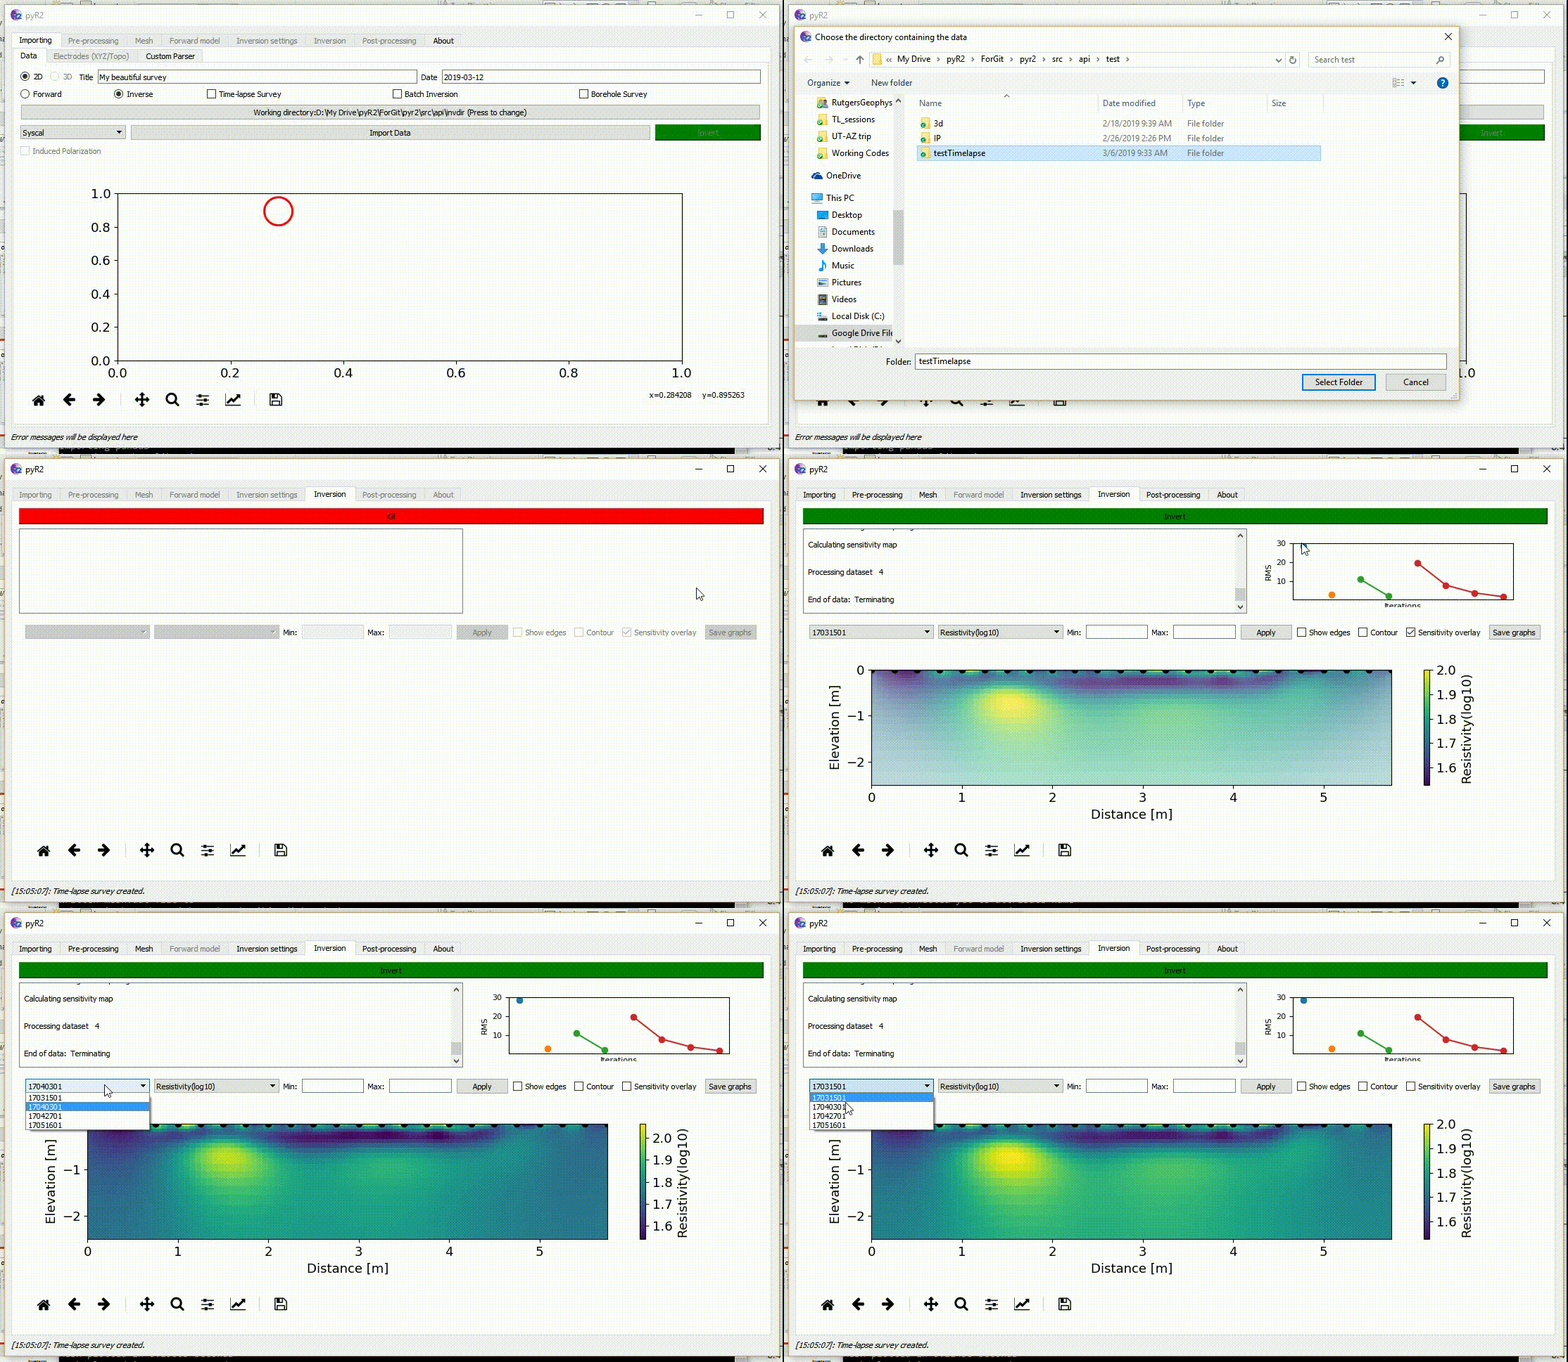
Fig. 10 Time-Lapse processing and inversion.
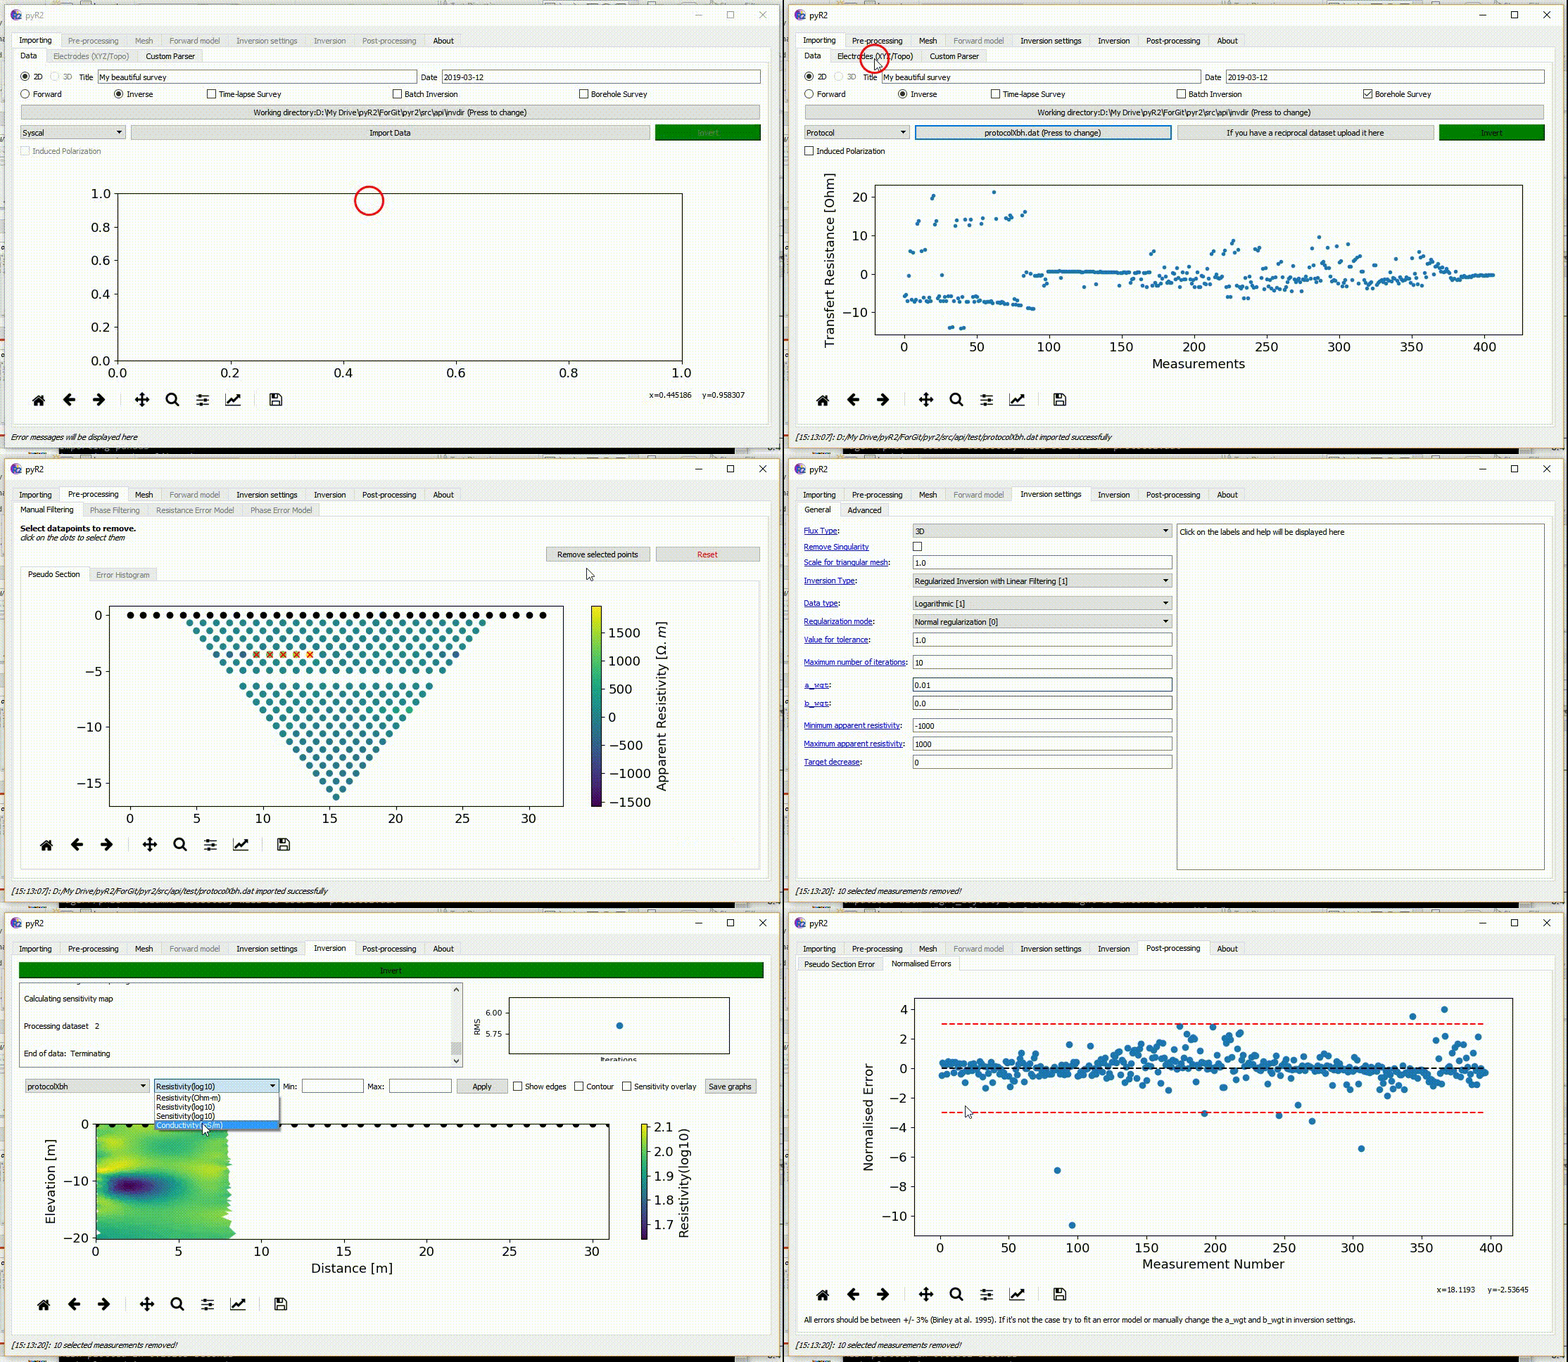
Fig. 11 Inversion of cross-borehole data.
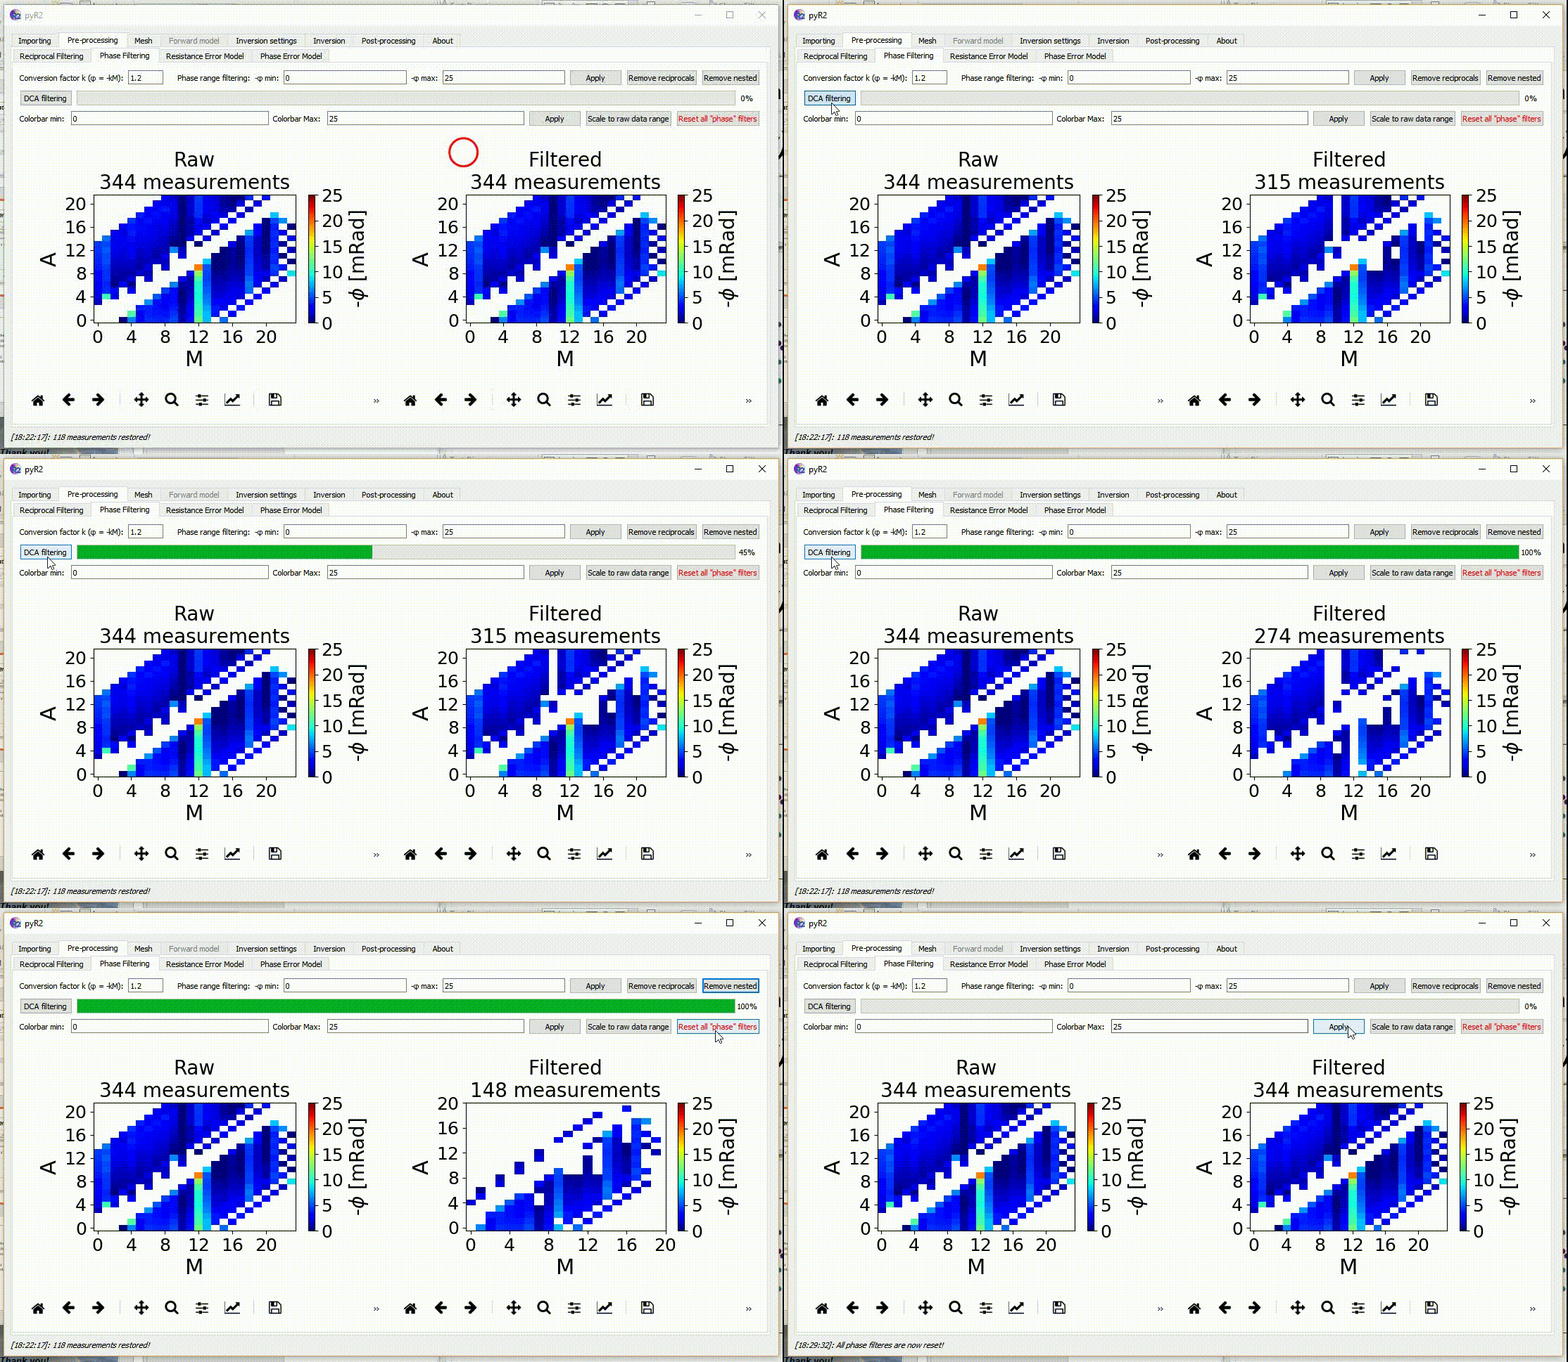
Fig. 12 Filtering of IP (Phase) data using vmin/vmax, DCA filtering and other tools.
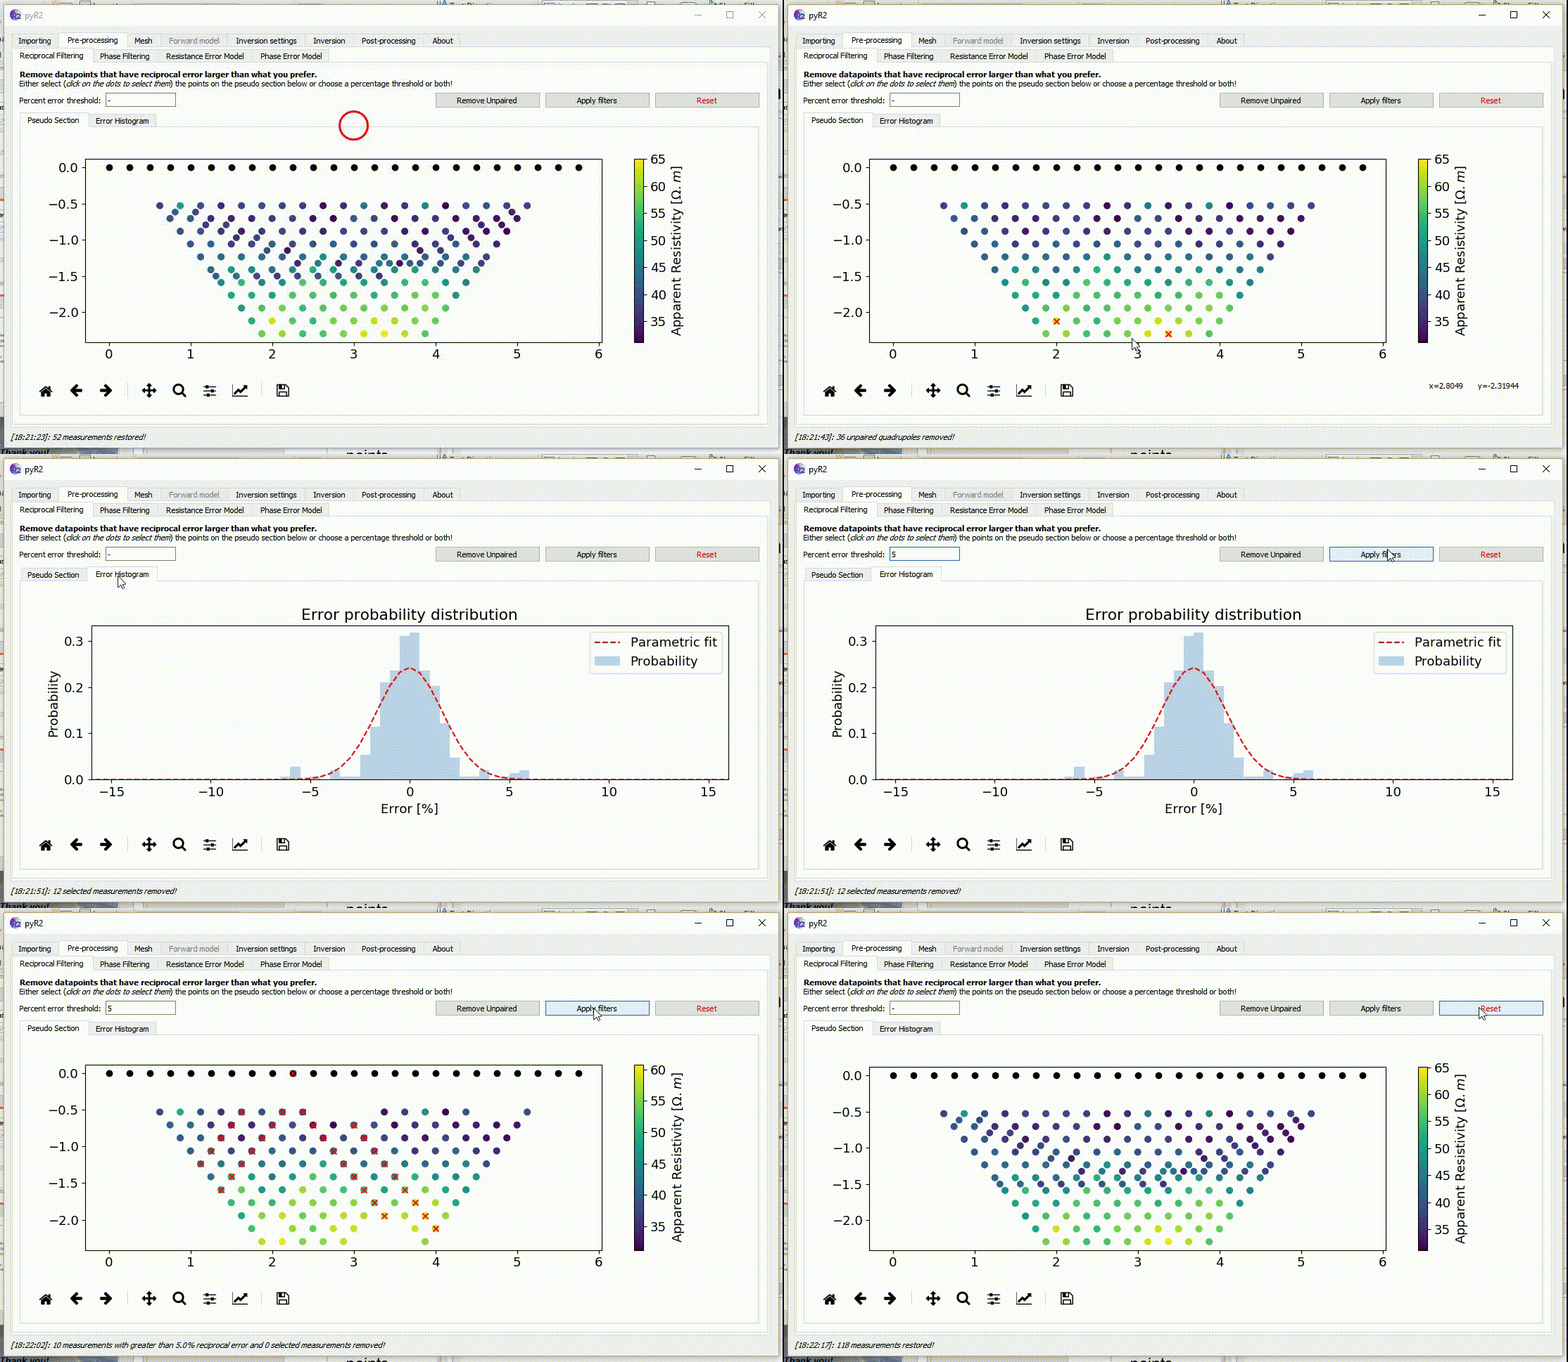
Fig. 13 Filtering based on reciprocal error.
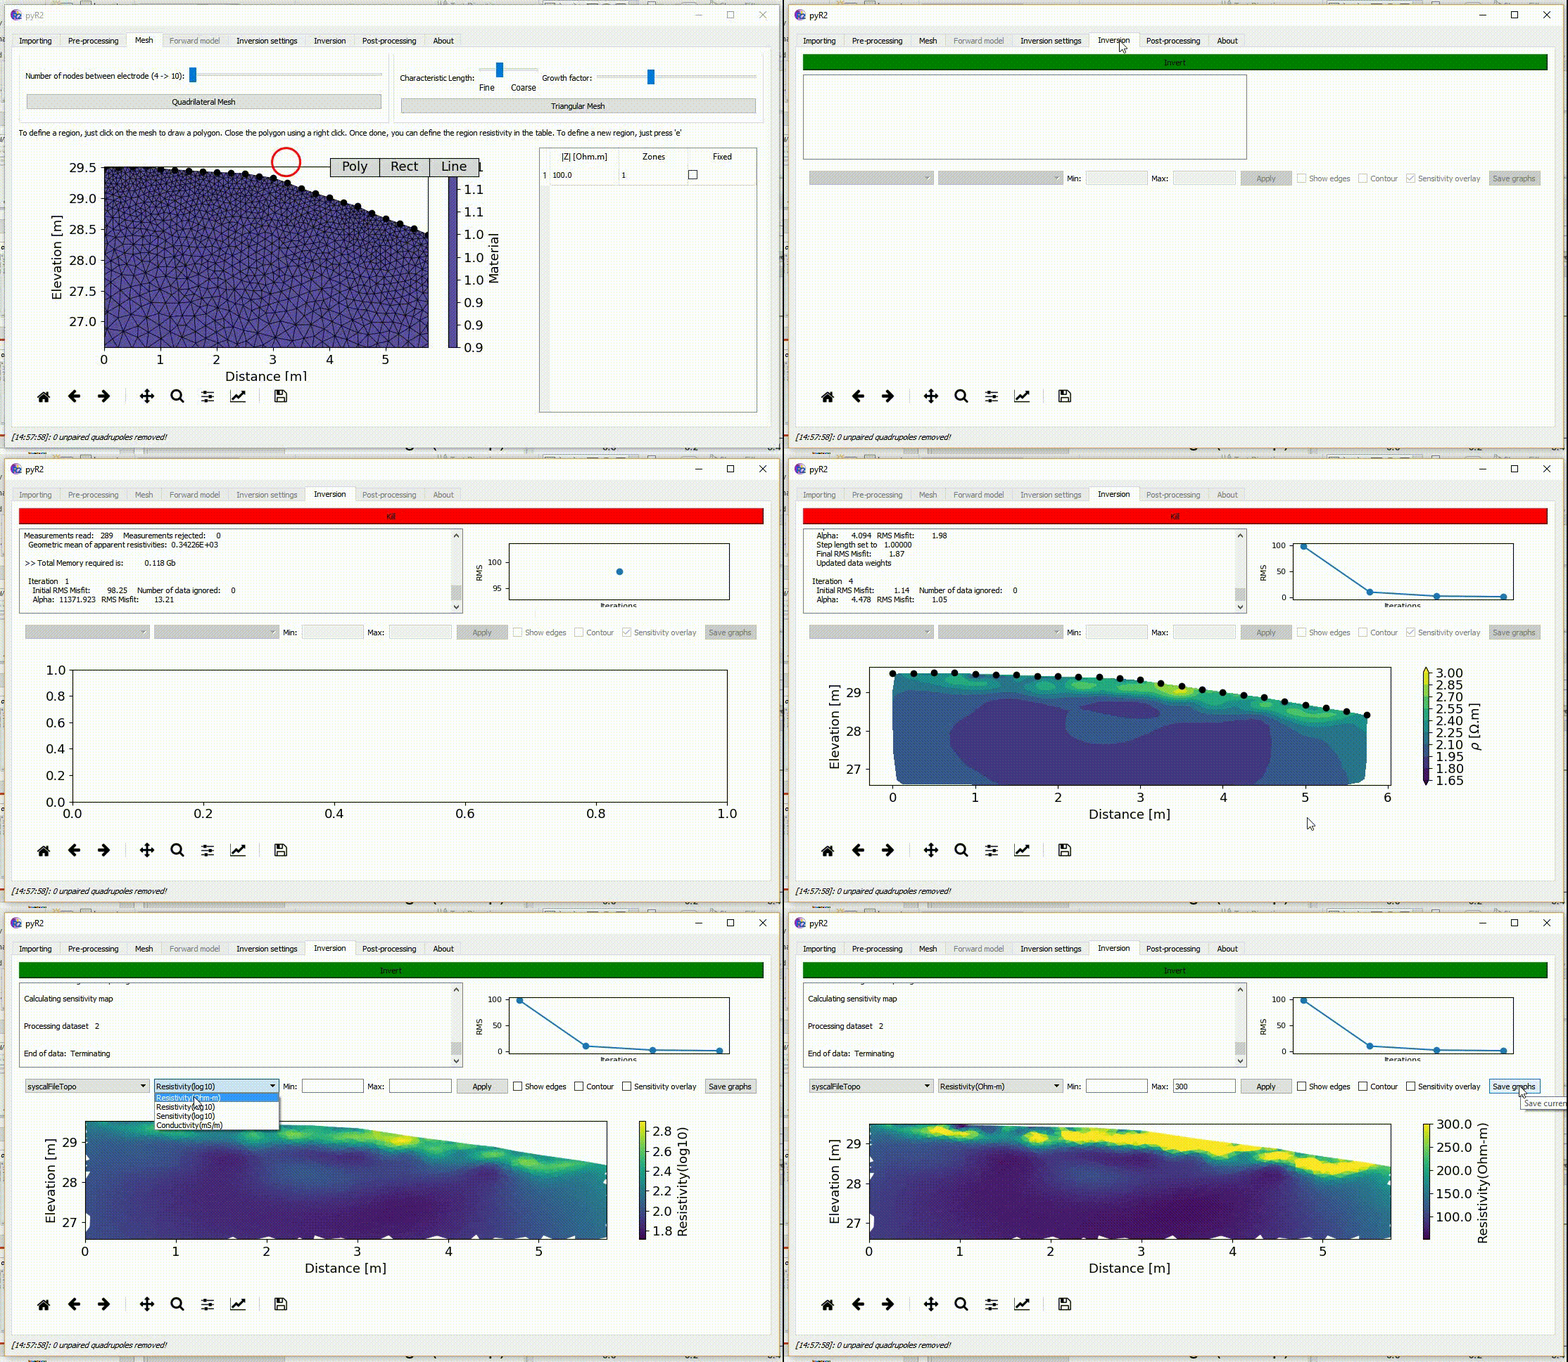
Fig. 14 Inversion settings as well as results displayed.
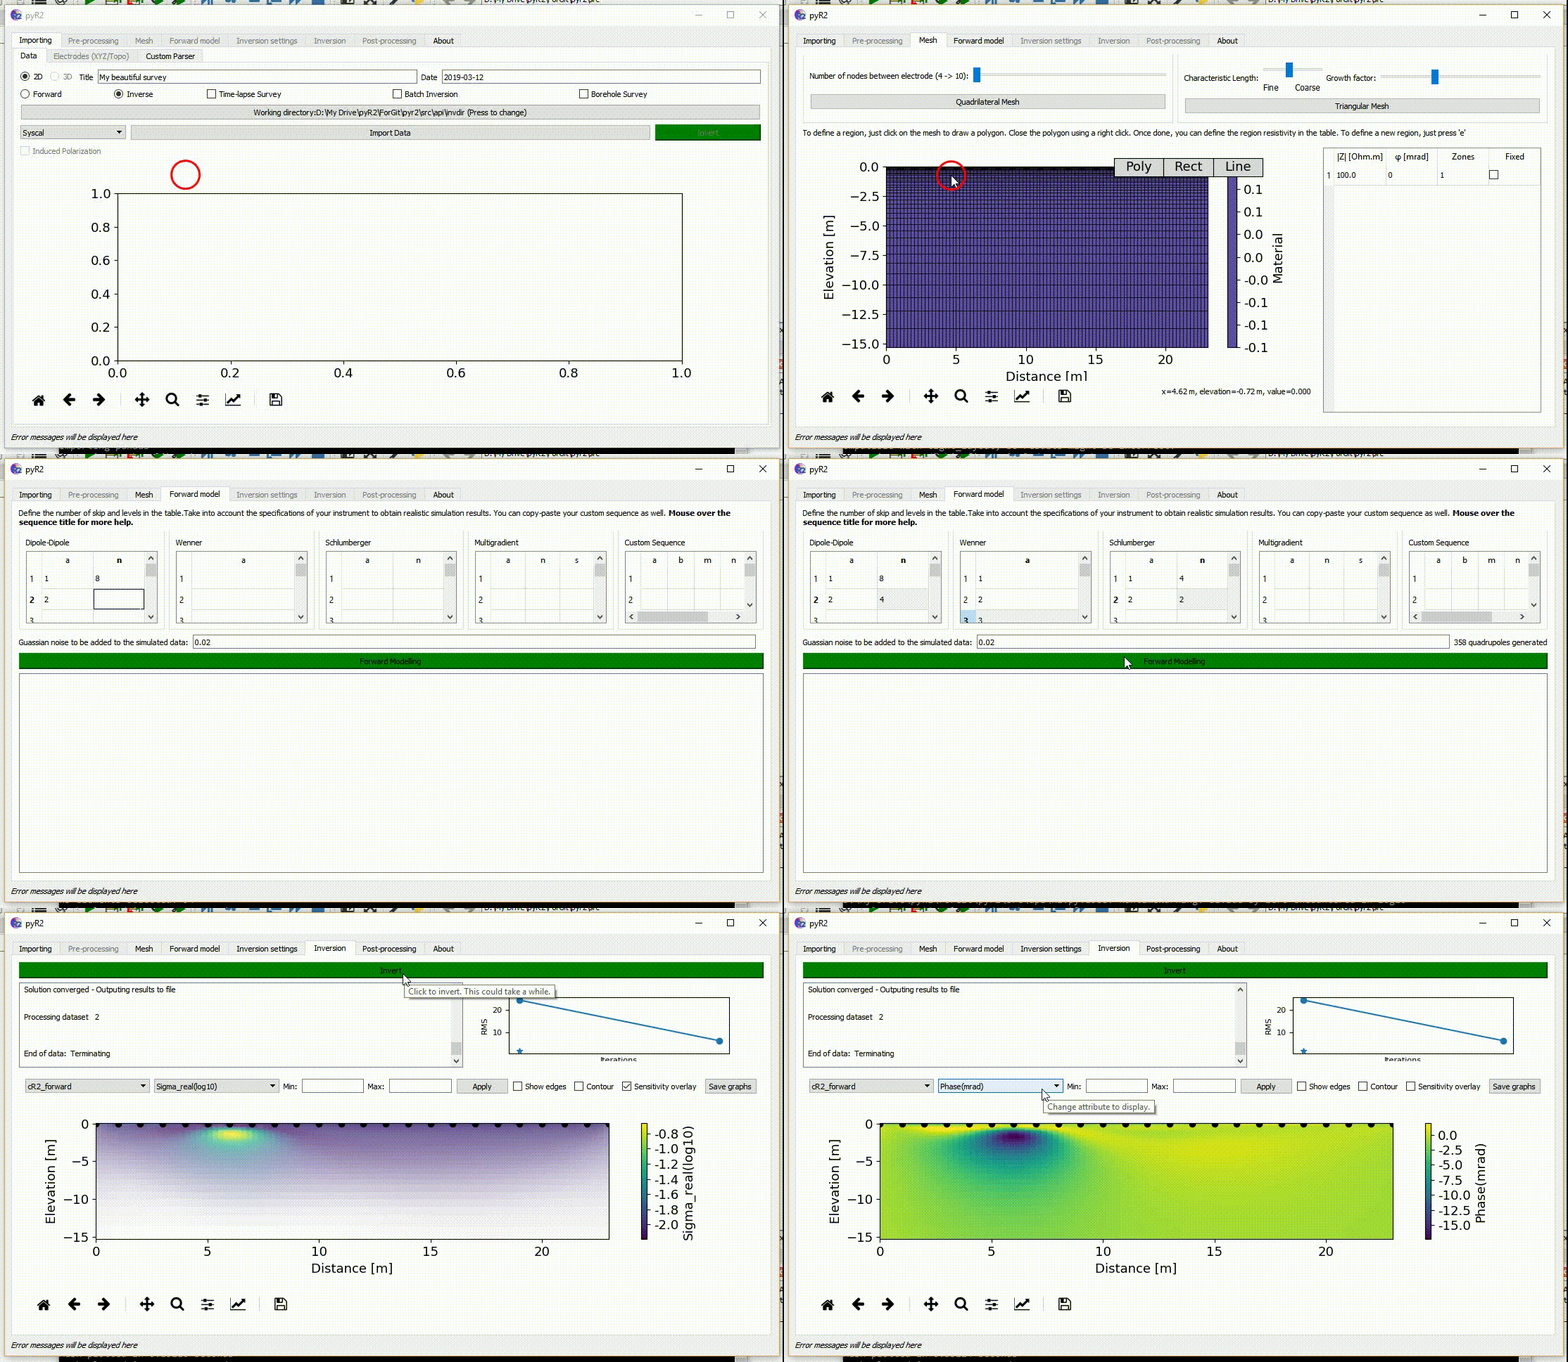
Fig. 15 Forward modelling on a flat surface.
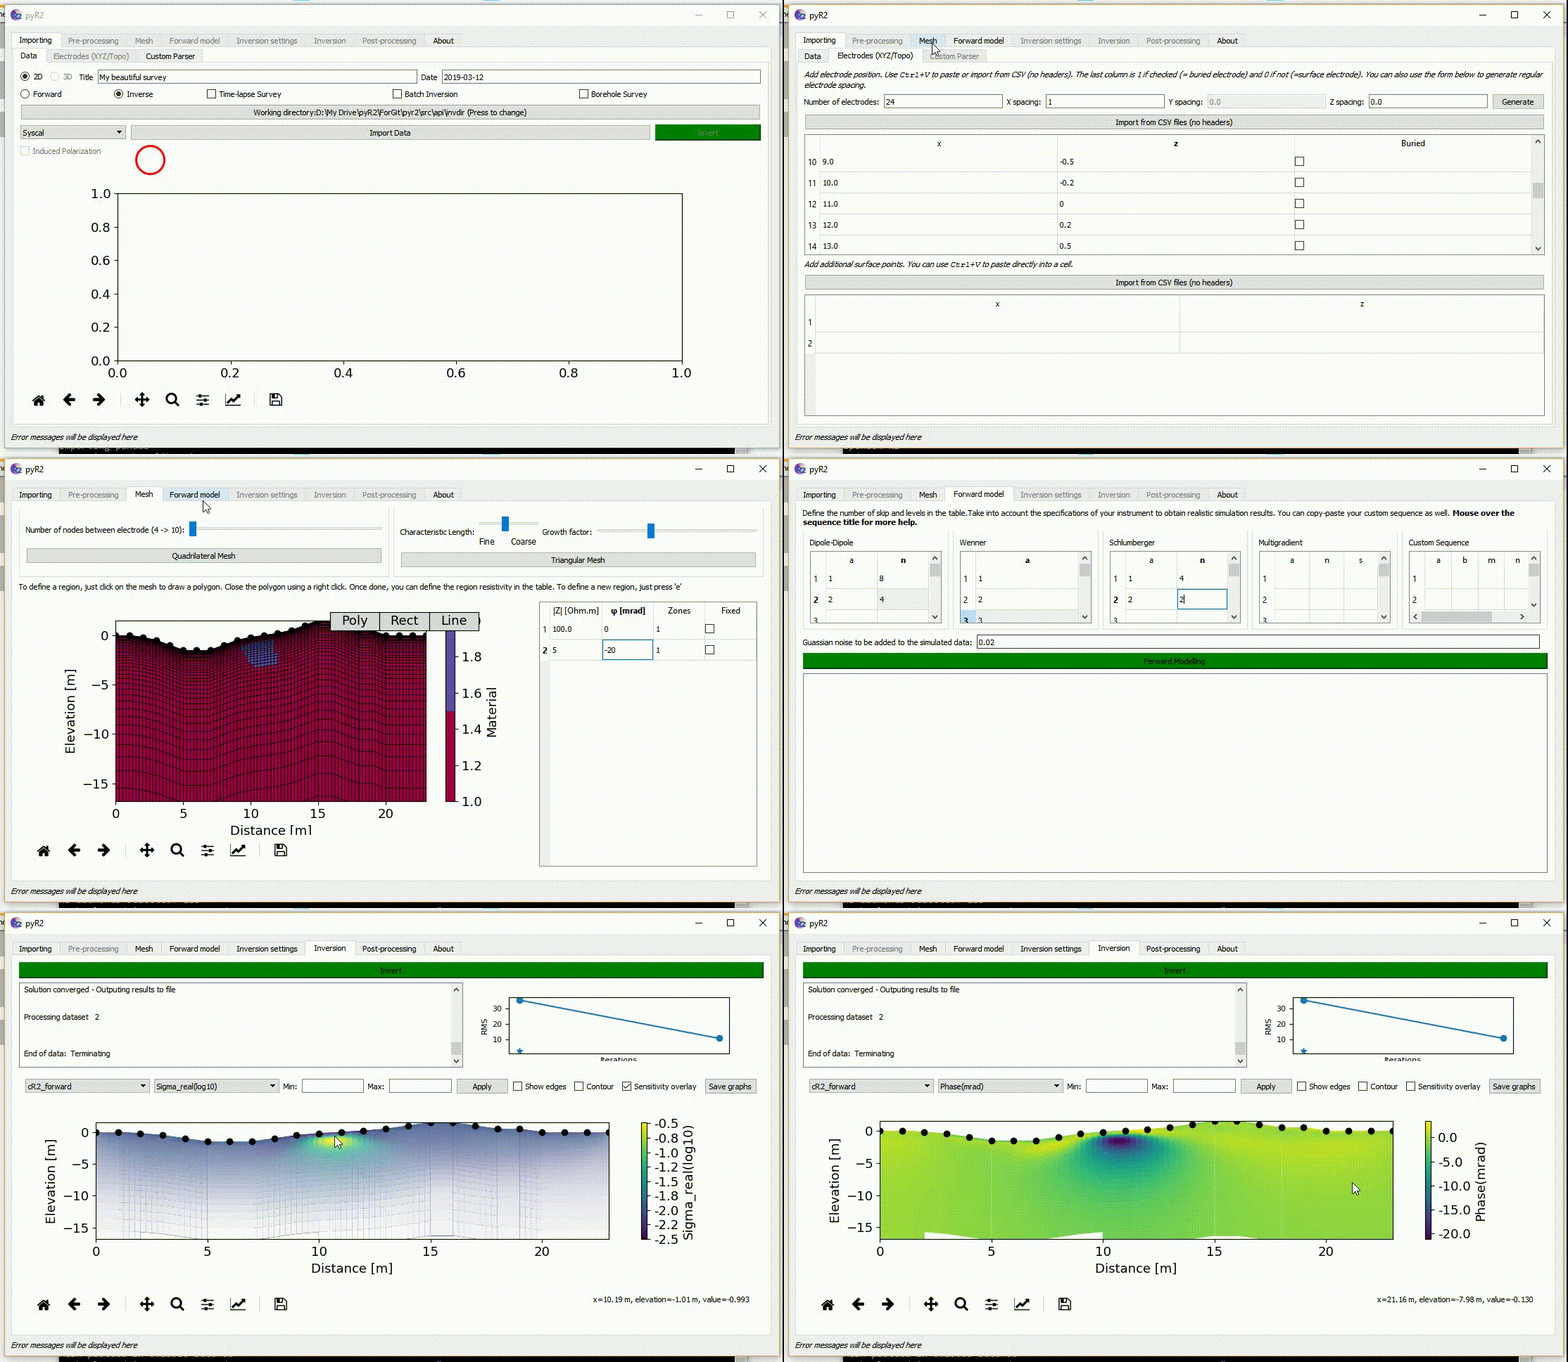
Fig. 16 Forward modelling with topography.