Graphical User Interface
The Graphical User Interface (GUI) is composed of differents tabs.
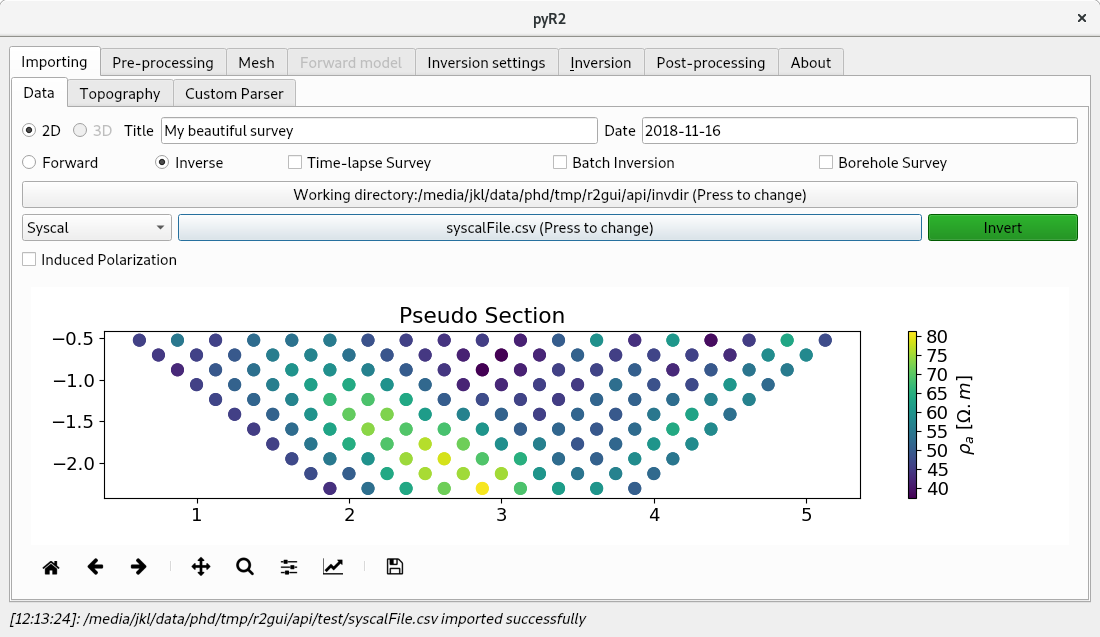
Fig. 1 Importing tab with the syscalFile.csv dataset. Filtering options are availables.
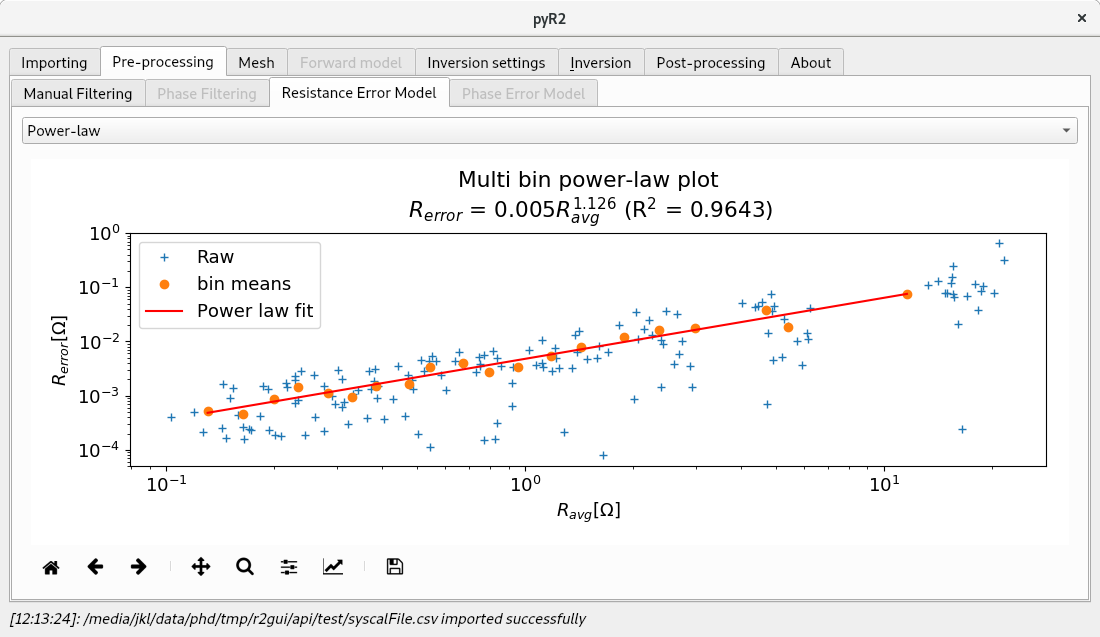
Fig. 2 An error model for DC or IP can be fitted if reciprocal measurements are present in the dataset.
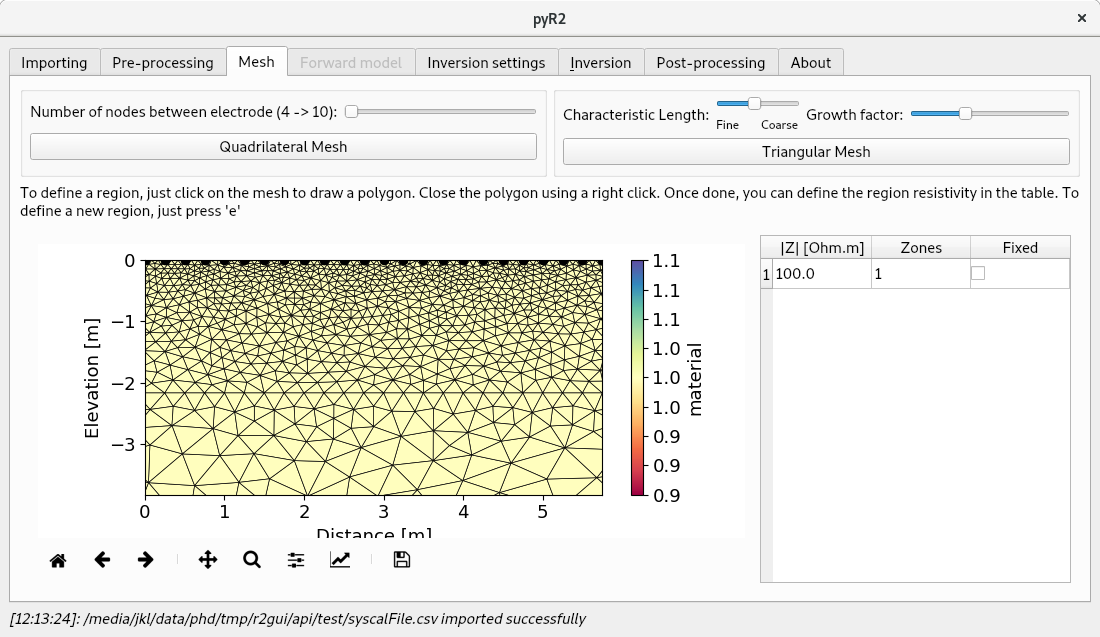
Fig. 3 A quadrilateral and a triangular mesh can be created before inversion.
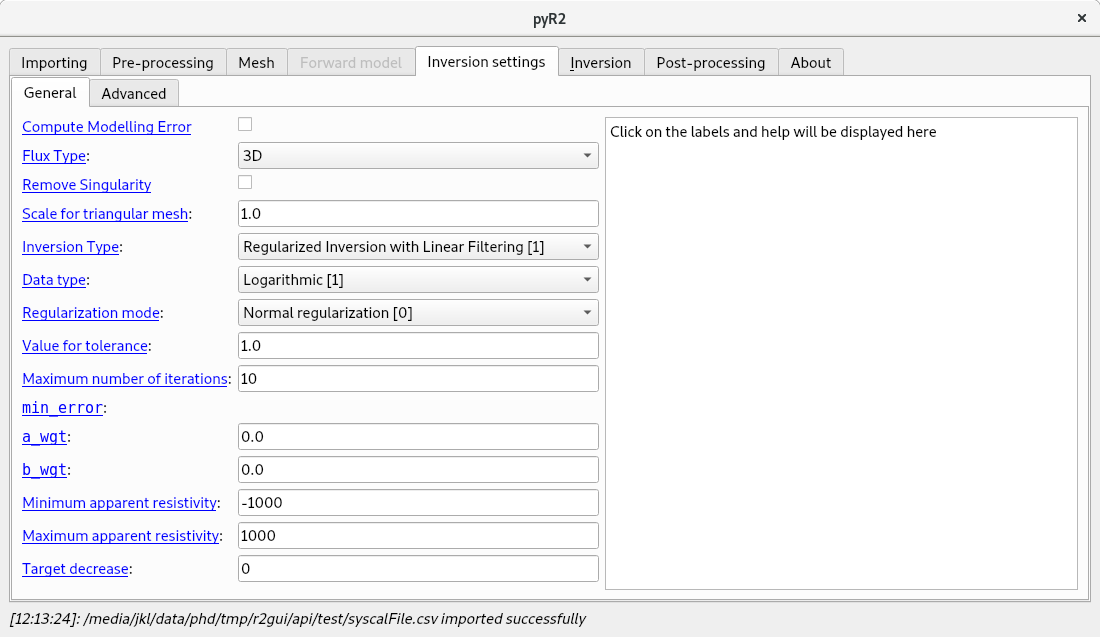
Fig. 4 Tab containing all the inversion settings available.
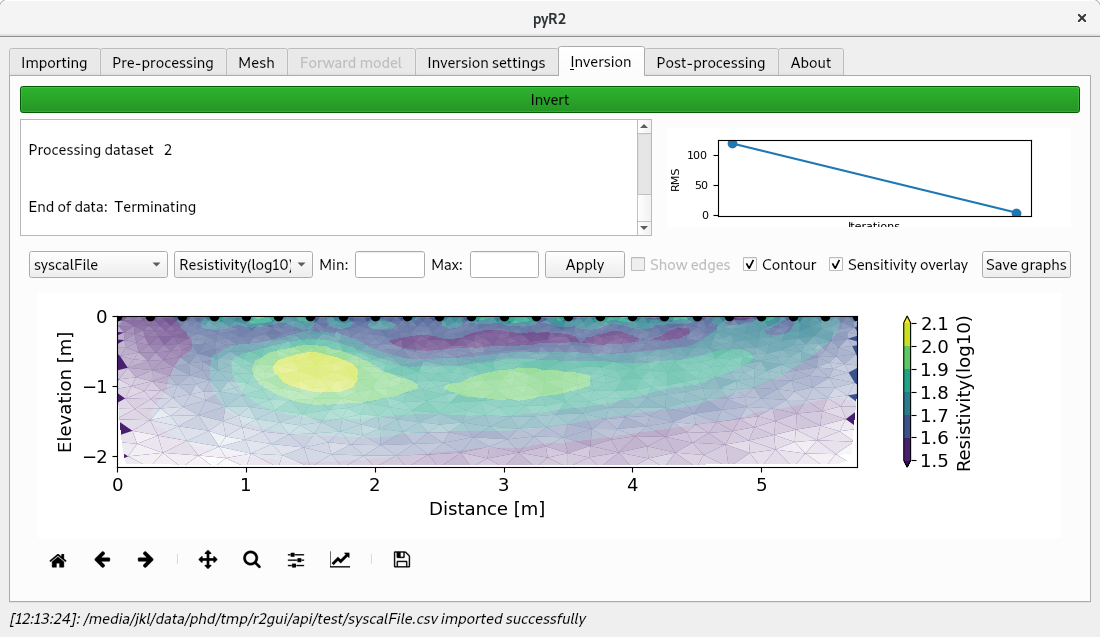
Fig. 5 Inversion tab where the inversion log is displayed as well as the RMS decrease for each iteration.