This page was generated from
jupyter-notebook/nb_05cross-borehole.ipynb.
Interactive online version:
 .
Download notebook.
.
Download notebook.
Cross-Borehole example
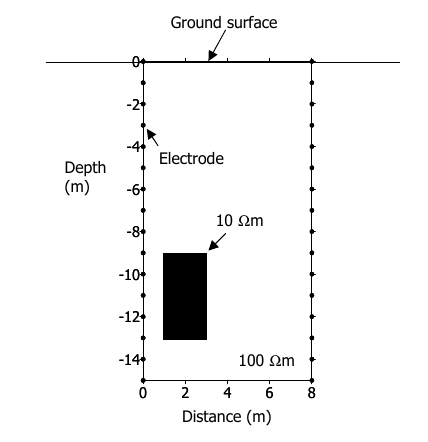
In this example we are going to invert one of the example given in the R2 manual. The aim is to detect a hidden block in the bottom left of the picture as shown below: and this pictures:
[1]:
%matplotlib inline
import warnings
warnings.filterwarnings('ignore')
import os
import sys
import numpy as np # just for parsing the electrode position file
sys.path.append((os.path.relpath('../src'))) # add here the relative path of the API folder
testdir = '../src/examples/dc-2d-borehole/'
from resipy import Project
API path =  /media/jkl/data/phd/resipy/src/resipy
ResIPy version =  3.4.6
cR2.exe found and up to date.
R3t.exe found and up to date.
cR3t.exe found and up to date.
Then we will import the protocol.dat file that was outputed by the forward model with this geometry and invert it. Note what we also need to import the electrodes position from a .csv file with 3 columns:x, y, buried. The buried column contains 1 if the electrode is buried and 0 if not.
[2]:
k = Project(typ='R2')
k.createSurvey(testdir + 'protocol.dat', ftype='ProtocolDC')
k.importElec(testdir + 'elec.csv')
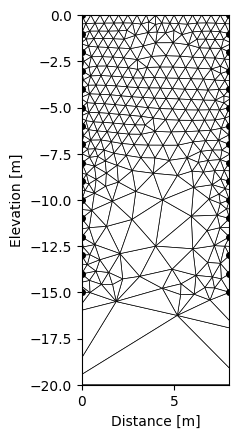
k.createMesh('trian', cl=0.5, cl_factor=20, fmd=20)
# cl is characteristic length, it defines the resolution of the mesh around the electrodes, the smaller, the finer
# cl_factor is how the mesh will grow away from the electrode
# NOTE that a too fine mesh (very small cl) will takes a lot of RAM
# but a too coarse mesh won't be able to resolve the target
k.zlim = [-20, 0]
k.showMesh()
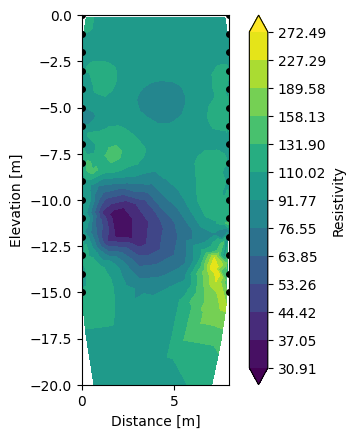
k.invert()
k.showResults(sens=False, contour=True)
Working directory is: /media/jkl/data/phd/resipy/src/resipy
clearing dirname
0/407 reciprocal measurements found.
Creating triangular mesh...done (1114 elements)
Writing .in file and protocol.dat... done

--------------------- MAIN INVERSION ------------------


 >> R  2    R e s i s t i v i t y   I n v e r s i o n   v4.10 <<

 >> D a t e : 03 - 12 - 2023
 >> My beautiful survey
 >> I n v e r s e   S o l u t i o n   S e l e c t e d <<
 >> Determining storage needed for finite element conductance matrix
 >> Generating index array for finite element conductance matrix
 >> Reading start resistivity from res0.dat
 >> R e g u l a r i s e d   T y p e <<
 >>   L i n e a r    F i l t e r    <<
 >> L o g - D a t a   I n v e r s i o n <<
 >> N o r m a l   R e g u l a r i s a t i o n <<
 >> D a t a   w e i g h t s   w i l l   b e  m o d i f i e d <<


 Processing dataset   1


 Measurements read:   407     Measurements rejected:     0
   Geometric mean of apparent resistivities:  0.92723E+02

 >> Total Memory required is:          0.004 Gb

   Iteration   1
     Initial RMS Misfit:         6.25       Number of data ignored:     1
     Alpha:        1404.342   RMS Misfit:        2.49  Roughness:        0.773
     Alpha:         651.838   RMS Misfit:        2.14  Roughness:        1.435
     Alpha:         302.556   RMS Misfit:        1.82  Roughness:        2.544
     Alpha:         140.434   RMS Misfit:        1.58  Roughness:        4.135
     Alpha:          65.184   RMS Misfit:        1.41  Roughness:        6.322
     Alpha:          30.256   RMS Misfit:        1.28  Roughness:        9.578
     Alpha:          14.043   RMS Misfit:        1.19  Roughness:       14.884
     Alpha:           6.518   RMS Misfit:        1.19  Roughness:       23.529
     Step length set to   1.00000
     Final RMS Misfit:        1.19
     Attempted to update data weights and caused overshoot
     treating as converged

 Solution converged - Outputing results to file

 Calculating sensitivity map


 Processing dataset   2


 End of data:  Terminating
1/1 results parsed (1 ok; 0 failed)
All ok
/media/jkl/data/phd/resipy/doc/gallery/../../src/resipy/meshTools.py:1487: MatplotlibDeprecationWarning: The collections attribute was deprecated in Matplotlib 3.8 and will be removed two minor releases later.
  for col in cont.collections:
/media/jkl/data/phd/resipy/doc/gallery/../../src/resipy/Project.py:4136: MatplotlibDeprecationWarning: The collections attribute was deprecated in Matplotlib 3.8 and will be removed two minor releases later.
  colls = mesh.cax.collections if contour == True else [mesh.cax]
[ ]: