This page was generated from
jupyter-notebook/nb_3d-visualisation.ipynb.
Interactive online version:
 .
Download notebook.
.
Download notebook.
3D viewing
This notebook will show how to display 3D results with resipy in a notebook. Note that 3D viewing is based on the Python package: pyvista that needs to be installed (pip install pyvista).
[1]:
import sys
sys.path.append('../src')
from resipy import Project
import pyvista as pv
testdir = '../src/examples/'
API path =  /media/jkl/data/phd/resipy/src/resipy
ResIPy version =  3.4.6
cR2.exe found and up to date.
R3t.exe found and up to date.
cR3t.exe found and up to date.
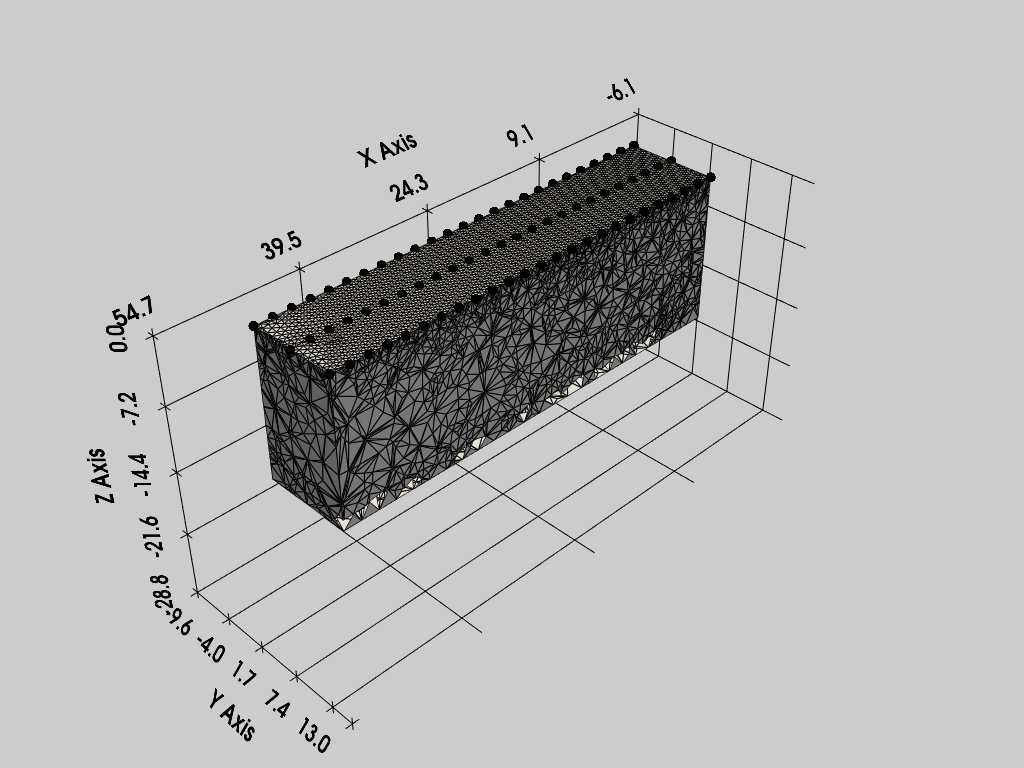
Create a Survey and Mesh, then display the mesh using a pyvista plotter object (which displays inline with the notebook).
[2]:
k = Project(typ='R3t')
k.createSurvey(testdir + 'dc-3d/protocol.dat', ftype='ProtocolDC')
k.importElec(testdir + 'dc-3d/elec.csv')
k.createMesh()
pl = pv.Plotter() # init pyvista plotter object
k.showMesh(ax=pl)
Working directory is: /media/jkl/data/phd/resipy/src/resipy
clearing dirname
0/644 reciprocal measurements found.
Creating tetrahedral mesh...done (62877 elements)
/media/jkl/data/phd/resipy/pyenv/lib/python3.10/site-packages/pyvista/jupyter/notebook.py:33: UserWarning: Failed to use notebook backend:

No module named 'trame'

Falling back to a static output.
  warnings.warn(
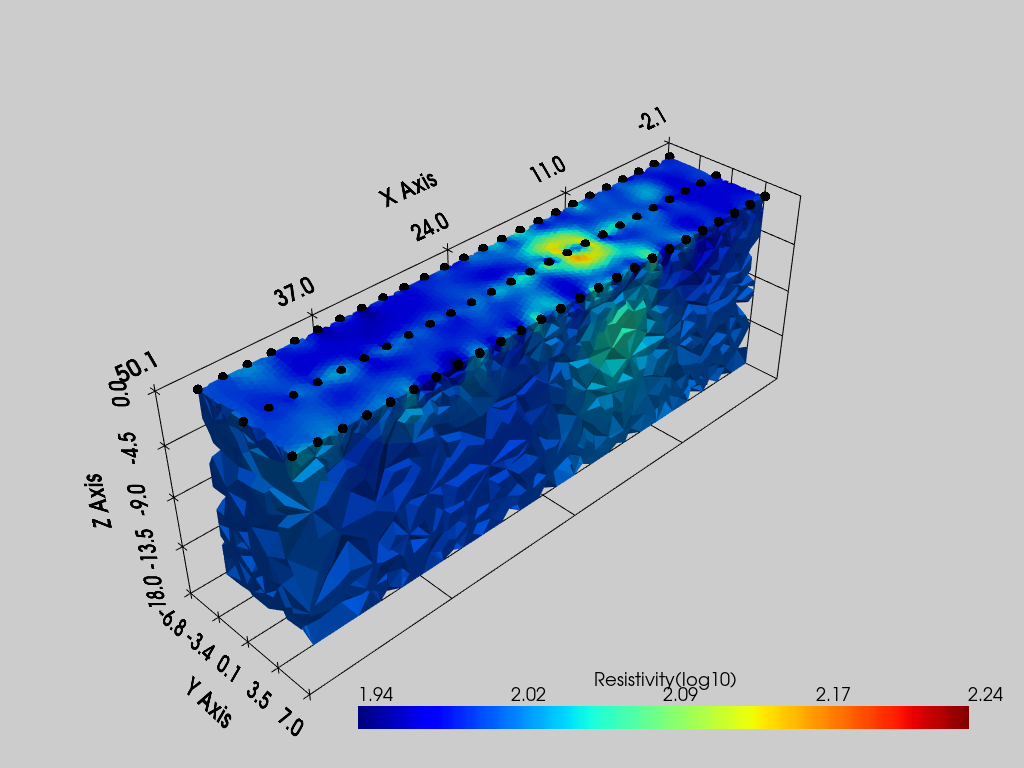
Now invert the data
[3]:
k.invert()
Writing .in file and protocol.dat... done

--------------------- MAIN INVERSION ------------------


 >> R 3 t     E R T    M o d e l    v 2.31 <<

 >> Date: 03-12-2023
 >> My beautiful 3D survey
 >> I n v e r s e   S o l u t i o n   S e l e c t e d <<
 >> A d v a n c e d   M e s h   I n p u t <<
 >> T e t r a h e d r a l   E l e m e n t   M e s h <<

 >> Reading mesh file
 >> Determining storage needed for finite element conductance matrix
 >> Generating index array for finite element conductance matrix
 >> Reading resistivity model from res0.dat

 >> L o g - D a t a   I n v e r s i o n <<
 >> N o r m a l   R e g u l a r i s a t i o n <<

 >> Memory estimates:
    For   1000 measurements the memory needed is:          0.521 Gb
    For   2000 measurements the memory needed is:          1.024 Gb
    For   5000 measurements the memory needed is:          2.534 Gb
    For  10000 measurements the memory needed is:          5.049 Gb

 >> Forming roughness matrix

 >> Number of measurements read:  644

 >> Total Memory required is:          0.342 Gb


 Processing frame   1 - output to file f001.dat

   Iteration   1
     Initial RMS Misfit:         2.61      Number of data ignored:     0
     Alpha:          21.523   RMS Misfit:        0.36  Roughness:        5.440
     Step length set to      1.000
     Final RMS Misfit:        0.36
     Final RMS Misfit:        1.01

 Solution converged - Outputing results to file

 Calculating sensitivity map

 End of data:  Terminating


 >> Program ended normally

1/1 results parsed (1 ok; 0 failed)
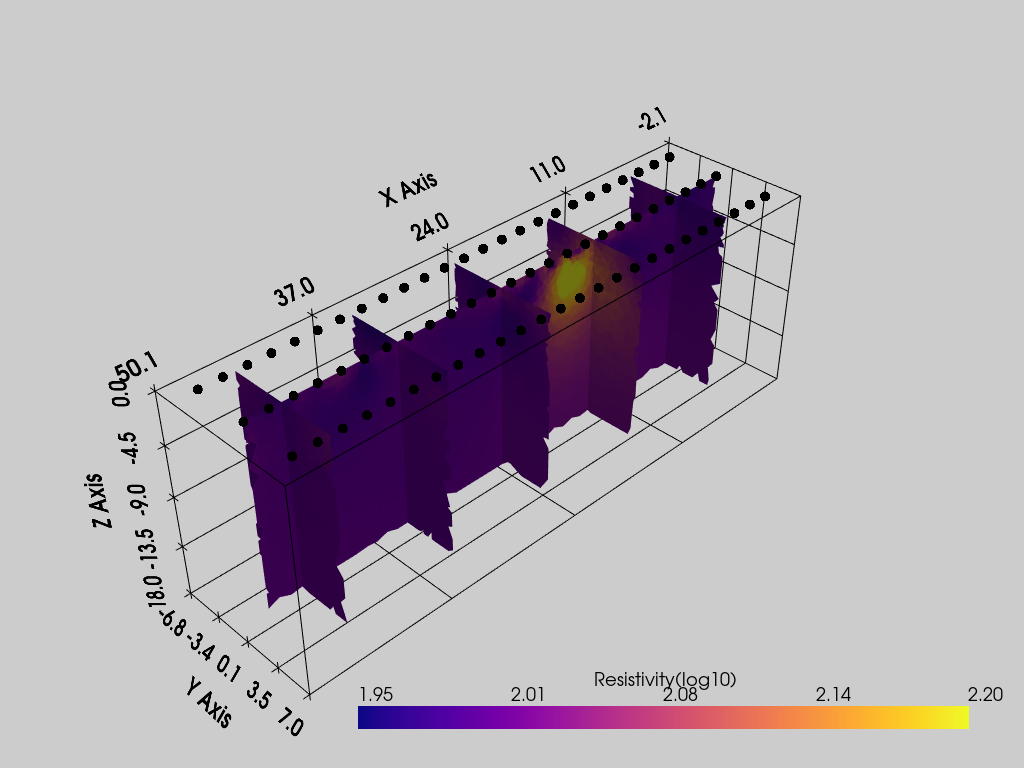
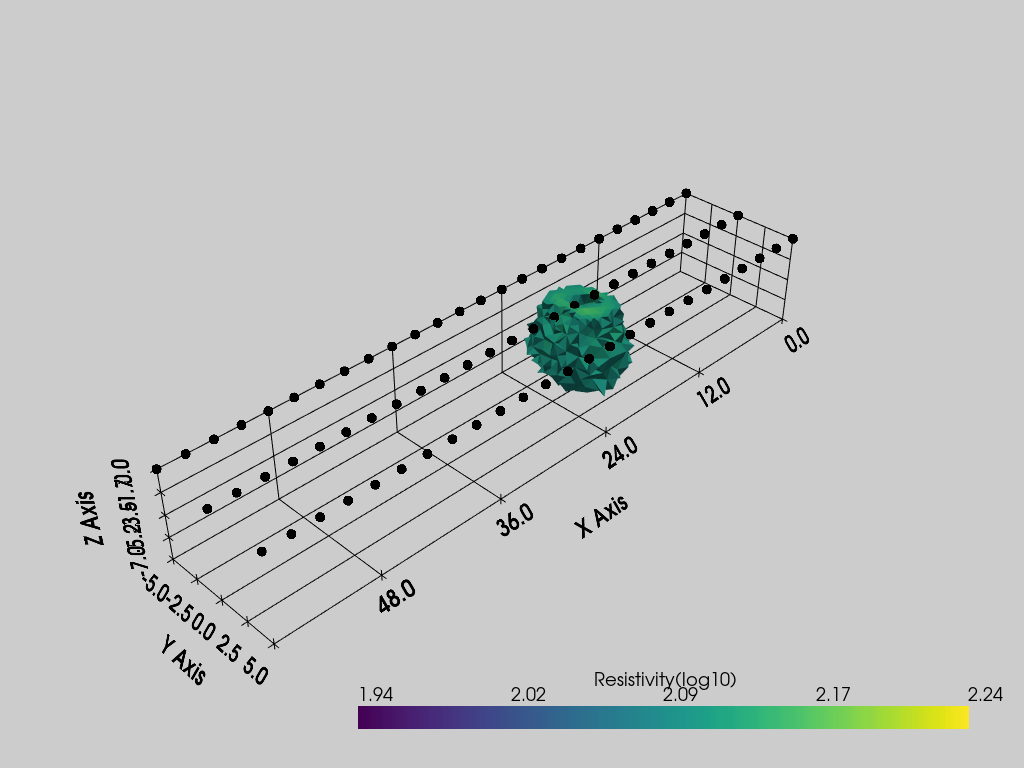
Options available
pvslices: a tuple of list, each list represent the coordinates of an slice orthogonal to X, Y and Z respectivelypvthreshold: a list of two values representing the minimum and maximum values between which to keep the cellspvcontour: a list of values at which draw isosurfacespvgrid: a bool, ifTrue, the grid is plotted
[4]:
pl = pv.Plotter()
k.showResults(ax=pl, color_map='jet')
/media/jkl/data/phd/resipy/pyenv/lib/python3.10/site-packages/pyvista/jupyter/notebook.py:33: UserWarning: Failed to use notebook backend:

No module named 'trame'

Falling back to a static output.
  warnings.warn(
[5]:
pl = pv.Plotter()
k.showResults(ax=pl, pvslices=([5,15,25,35,45],[0],[]), pvgrid=True, vmin=1.95, vmax=2.2, color_map='plasma')
/media/jkl/data/phd/resipy/pyenv/lib/python3.10/site-packages/pyvista/jupyter/notebook.py:33: UserWarning: Failed to use notebook backend:

No module named 'trame'

Falling back to a static output.
  warnings.warn(
[6]:
pl = pv.Plotter()
k.showResults(ax=pl, pvthreshold=[2.1, 2.2], pvgrid=True)
/media/jkl/data/phd/resipy/pyenv/lib/python3.10/site-packages/pyvista/jupyter/notebook.py:33: UserWarning: Failed to use notebook backend:

No module named 'trame'

Falling back to a static output.
  warnings.warn(
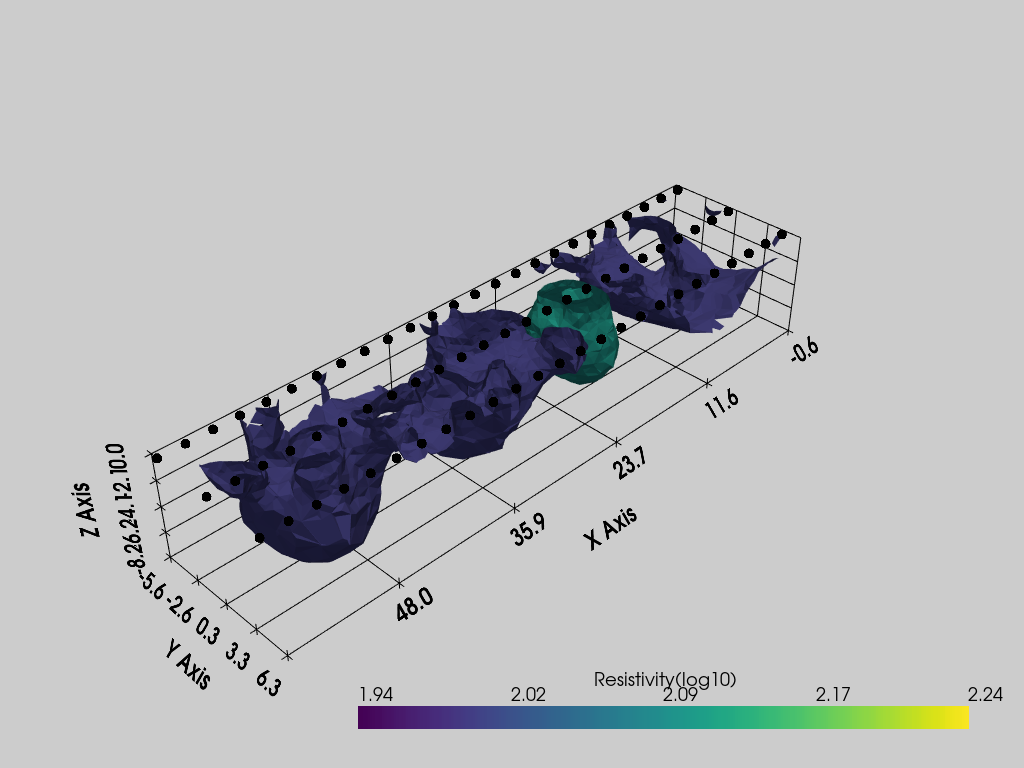
[7]:
pl = pv.Plotter()
k.showResults(ax=pl, pvcontour=[2, 2.1], pvgrid=True)
/media/jkl/data/phd/resipy/pyenv/lib/python3.10/site-packages/pyvista/jupyter/notebook.py:33: UserWarning: Failed to use notebook backend:

No module named 'trame'

Falling back to a static output.
  warnings.warn(
[ ]: